Convenient performance tracking in ColdFusion and Lucee
I’m working on the old code right now and I try to perform some performance adjustments. The majority of work now relies on the identification of weak points and places where improvement is possible. In order to do this, I used to dump “getTickCount” values, save them in temporary variables and compare execution time. As the solution to my needs, I came up with the component that displays execution time like this:
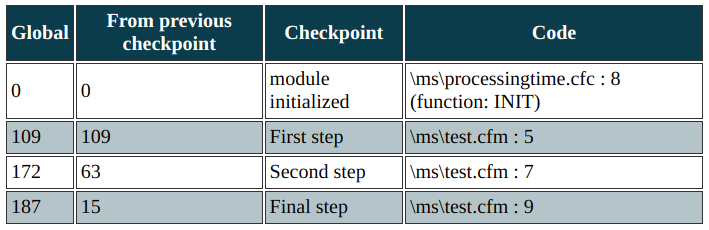
In the table above, you can see (from left to right):
- global execution time from the moment the component was initialized
- execution time between current checkpoint and the previous one
- name of the checkpoint
- information on where the checkpoint creation was requested (name of the file and the line in the code)
Here is how the code that calls the module looks like:
<cfscript>
    pt = new ms.processingtime();
    sleep(100);
    pt.putTimeLog('First step');
    sleep(50);
    pt.putTimeLog('Second step');
    sleep(10);
    pt.putTimeLog('Final step');
    writeOutput( pt.timeLogAsTable() );
</cfscript>
If you will define the component in the “request” scope, you will have it available across multiple files, so you can collect performance data in various places. I’m using it to research across the whole application and to identify weak points.
The code of the module itself is as follows (file “processingtime.cfc”):
component {
    public processingtime function init () {
        variables.initialized = getTickCount();
        variables.lastCheckpointTime = getTickCount();
        variables.lastCheckpointName = 'module started';
        variables.log = [];
        putTimeLog('module initialized');
        return this;
    }

    public numeric function putTimeLog(required string checkpointName) {
        var tick = getTickCount();
        var stack = CallStackGet();
        var stackText = "";
        try {
            stackText = "#stack[2].template# : #stack[2].LineNumber# #(stack[2].function NEQ ""?"(function: #stack[2].function#)":"")#";
        } catch (any e) {
            stackText = e.message;
        }
        arrayAppend(variables.log, {
            previousCheckpoint : variables.lastCheckpointName,
            currentCheckpoint : arguments.checkpointName,
            timeFromInit : tick - variables.initialized,
            timeFromLast : tick - variables.lastCheckpointTime,
            stackText : stackText
        });
        variables.lastCheckpointName = arguments.checkpointName;
        variables.lastCheckpointTime = tick;
        return arraylen(variables.log);
    }

    public string function timeLogAsTable() {
        savecontent variable="returnVar" {
            writeOutput('
                <div class="processing-log-table-container">
                <table class="processing-log-table">
                    <tr>
                        <th>Global</th>
                        <th>From previous checkpoint</th>
                        <th>Checkpoint</th>
                        <th>Code</th>
                    </tr>
            ');
            for (var i=1; i<=arraylen(variables.log); i++) {
                writeOutput('
                    <tr>
                        <td>#variables.log[i].timeFromInit#</td>
                        <td>#variables.log[i].timeFromLast#</td>
                        <td>#variables.log[i].currentCheckpoint#</td>
                        <td>#variables.log[i].stackText#</td>
                    </tr>
                ');
            }
            writeOutput('
                </table>
                </div>
            ');
        }
        return returnVar;
    }

}