Pivot pandas dataframe – convert row to columns (and join this to the rest of the other dataframe)
In my previous post, I wrote about the quick way to generate Excel export from the database using Python. This was a simple report, but in fact, I had to make more operations, which I describe in this post.
I’m still using the example MySQL database, so you can try to reproduce this on your own. Let’s assume that I have to obtain salaries with the start year of salary for each employee. I will use such a query:
SELECT emp_no, salary, year(from_date) AS salary_start_year
FROM salaries
This is a silly example, but I have to start with something. The above will produce something like this:
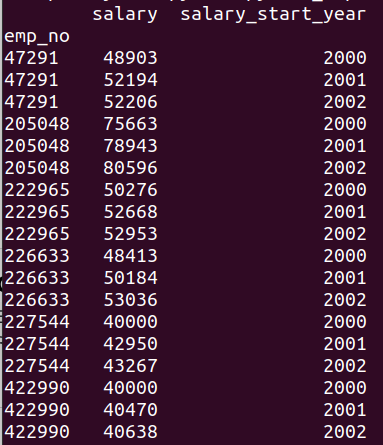
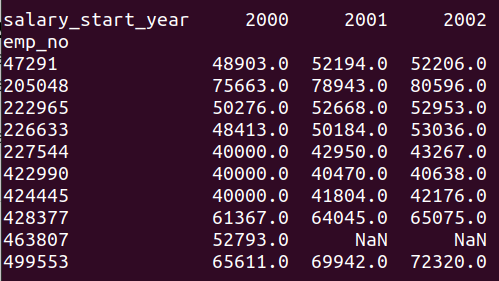
As you can see, there are multiple records for each employee. I would like to have it rather in the form, where there is one row for employees and multiple columns to cover years of “2000”, “2001”, “2002” and so on. In order to achieve this, I will pivot the dataframe. Let’s take a look at the part of the code:
salary = get_salaries_data(employee_df["emp_no"].values)
salary_df = pd.DataFrame.from_dict(salary).set_index(["emp_no"], drop=False)

salary_pivot = salary_df.pivot(index=["emp_no"], columns="salary_start_year", values="salary")
The salary dataframe is created from the query results and the index is set on “emp_no” without dropping the column itself. It will be useful for pivoting. The pivot function takes the index we want to use, the columns (in our case – only one) we want to be created from rows, and the value to put in these columns. As a result, we receive such a dataframe:
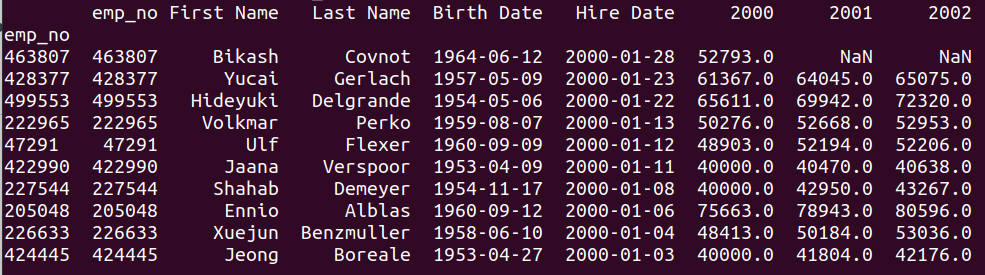
Now it is time to connect this to our employees dataframe:
df_report = pd.concat([employee_df, salary_pivot], axis=1)
The dataframes are connected using indexes, so there is nothing more to declare. The result is:
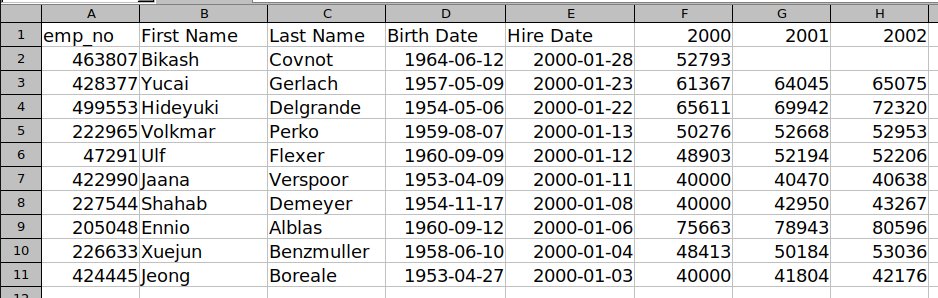
And the Excel report generated from the above data looks like this:
The whole code of the example above is:
import pandas as pd
import mysql.connector
from openpyxl import Workbook
from openpyxl.utils.dataframe import dataframe_to_rows

connection = None


def run():
    connect()
    employee_data = get_employee_data()
    employee_df = pd.DataFrame.from_dict(employee_data).set_index(["emp_no"], drop=False)
    salary = get_salaries_data(employee_df["emp_no"].values)
    disconnect()

    salary_df = pd.DataFrame.from_dict(salary).set_index(["emp_no"], drop=False)
    salary_pivot = salary_df.pivot(index=["emp_no"], columns="salary_start_year", values="salary")
    df_report = pd.concat([employee_df, salary_pivot], axis=1)

    wb = Workbook()
    ws = wb.active
    ws.title = "Employee Report"
    for row in dataframe_to_rows(df_report, index=False, header=True):
        ws.append(row)

    wb.save("report2.xlsx")


def get_employee_data():
    query = """
        SELECT emp_no, first_name AS "First Name", last_name AS "Last Name",
            birth_date AS "Birth Date", hire_date AS "Hire Date"
        FROM employees
        ORDER BY hire_date DESC
        LIMIT 0, 10
    """
    cursor = connection.cursor(dictionary=True)
    cursor.execute(query)
    result = cursor.fetchall()
    cursor.close()
    return result


def get_salaries_data(emp_id_list):
    query = """
        SELECT emp_no, salary, year(from_date) AS salary_start_year
        FROM salaries
        WHERE emp_no in ({s})
        ORDER BY emp_no, year(from_date)
    """.format(
        s=",".join(str(n) for n in emp_id_list)
    )
    cursor = connection.cursor(dictionary=True)
    cursor.execute(query)
    result = cursor.fetchall()
    cursor.close()
    return result


def disconnect():
    connection.close()


def connect():
    global connection
    connection = mysql.connector.connect(
        user="DB_USER",
        password="DB_PASS",
        host="DB_HOST",
        database="DB_NAME",
    )